As the housing market shifts and balances under the pressure of higher interest rates and inflation, the state of the market and any projections for the short term can at times become murky. When that happens sometimes it’s best to just sit back and watch for a moment where we can see clearly again. Real Estate is a REALTOR® business and we know it best! Let’s take a look at the Greater Phoenix market more in depth.
Before we can focus on how Phoenix is holding up we have to look at the root of this problem a little bit. With so much talk about recession, inflation, interest rates, gas prices and the sky falling what should we be planning ahead for?
The Finance Behind the Pain
CPI vs. PCE and Inflation

If you’ve listened at all to any media source regarding finance you hear them speak often about Powell and the CPI as the driving force behind the interest rate increases. While the CPI is utilized for certain things, the CPI is based on the consumer survey which is shaky at best as far as accuracy. This housing indicator at 42.1% in the CPI is based on the monthly cost to rent, not the cost of monthly mortgage payments! If you are renting you are consuming housing, if you own your home you are invested in real estate. Thankfully, Powell isn’t putting as much weight on the CPI!
What Powell is paying far more attention to is the PCE which measures consumer and business surveys. Business surveys are far more accurate because they reflect actual numbers regarding what items consumers are spending money on, how much in each category and whether they are choosing a less expensive item over the more expensive. For example, this would be the difference between buying organic foods rather than non-organic. If organic foods are seeing less movement and non-organic is seeing more movement then it reflects the belt tightening effect. People are still buying but they might be choosing a less expensive option.
If you look at the chart above you can clearly see the PCE puts more weight in “Medical Care” and “Other Goods and Services” than the CPI model. Housing carries less weight in the PCE at 22.1%. Again, home owners have lower mortgage payments than renters are paying in rent simply because of the lower interest rate period we just came out of.
The PCE model also reflects company contributions to employee medical insurance or other perks they provide to benefit their workforce showing a different picture. Please note there are 2 different government agencies that pull these numbers together and neither agency talks to each other. If you’d like to read more in depth here is an article for you https://www.thestreet.com/dictionary/p/personal-consumption-expenditures-index-pce
Inflation

While no one can predict inflation or interest rates (if they say they can they are just guessing) we can use some math to try and calculate when we may see some easing in our interest rates. Again, Powell is using the PCE and looking at the 2% inflation mark to measure victory. I’m most definitely not a math genius, but I can provide to you what the math geniuses are looking at. We have leveled off as far as inflation is concerned instead of seeing things surge like earlier on this year. If this math is adding up correctly we will be poised to have a healthy spring in the housing market.
Recession
You almost have to live under a rock to not have heard that either we are in a recession, are headed into a recession or something else about recession. So how do we know if we are in a recession? Who decides?

These guys decide whether or not we are in a recession. Whether we are currently in or about to enter into one, these guys are going to decide what shows up on my next slide for our current time period. If you would like to read more about these gentlemen here is a link to an article http://www.nber.org

Pay attention to the recessionary periods over time which are the grey bars and the red arrows showing rates declining. Each recession lasts between 6 months to 1.5 years. In every recession interest rates are expected to go down based on history! If you look closely at the chart above they don’t stay down. They go down, bounce up before going down more.
Most of the time we don’t know we are in a recession until one of these “smart guys” tells us we are officially in a recession. It all depends on what you believe about our current recessionary state to figure out what comes next based on history. Rates will come down just like they will go up! What we need to wait for is to see when and how quickly they will come back down.
Phoenix Housing and Jobs Market
Phoenix Jobs Market Outlook
If anyone remembers 2008 you remember it was devastating to the masses of people. Are we on track to experience another 2008?
In 2008 Phoenix was not very diversified in its jobs market nor did we have a real and true housing demand back then due to lower population levels and less business growth. We had more travel and tourism jobs, call centers and real estate or construction jobs than anything else. When one of those industries failed they all suffered with no where else to go for the employees of those industries. Well, let’s look at how much Phoenix has grown since that dreaded time in history in population, job growth and diversification of industry.


In the above slides we can see 55 companies have already moved or expanded their businesses to Phoenix creating 10,859 new jobs. We have 214 domestic companies and 58 international companies with their eye on Phoenix for future growth. The above companies reflect the first phase of hiring and who some of the companies are. Taiwan Semiconductor is a major win for Phoenix and some of these companies provide direct support to Taiwan Semiconductor while others are diversified in other industries. Let’s take a look at a broader landscape regarding the growth in the Phoenix Jobs Market over time and into the future shall we?

The above slide shows where business moving into Phoenix are slated to come from domestically. 55 businesses from California alone and 11 from New York. California and New York have some of the highest property taxes and home prices in the country. With employees moving into Phoenix from these locations we will see greater demand for housing across the city. This migration causing continued housing demand will support our property values and cause property values to continue to increase.

Above is a map reflecting all of the companies poised to move their businesses into the Phoenix market from other countries. It appears Phoenix is growing up nicely and ready to go to work! Below we can see the progression of Phoenix as it grew into the great jobs market we current enjoy starting in 2012 until 2022 with more to come. The last slide shows the locations of the up and coming jobs landscape.


What is the saying? A picture is worth 1000 words? Long story short Phoenix is a major destination for major business growth and development now and into the future. With business growth comes population growth comes the need for housing and other amenities that will continue to fuel more business growth to fill the demand from the population growth. This is all good news.
Unemployment Numbers
With all of the job growth already happening, and that is slated to happen, how are we looking as far as unemployment currently? Take a look at the slides below.

Prior to COVID in 2020 we had a 5% unemployment rate which spiked up to 13.9% during COVID. Looking at the recovery Phoenix experienced in the time since is a reflection of how Phoenix is slated to hold up under economic pressures moving forward. The blue line is AZ and the yellow is the US as a whole.

The above slide shows a roller coaster effect in our unemployment numbers with Phoenix in blue and the US in yellow dating back to 1975. Remember, Phoenix didn’t truly start growing into the city we now see until around 2012. If you look at the above chart from 2012 to present day, with the exception of COVID, there seems to be plenty of jobs to sustain the massive population growth Phoenix is experiencing. Greater Phoenix is growing at a rate of approximately 300 people per day to put that growth into perspective.

The above chart shows unemployment numbers leading up to, during and after each recorded recessionary period going back to 1950. History is the greatest indicator of what to expect moving forward. So basically in recessionary periods unemployment numbers increase while mortgage interest rates decline.
During COVID people were being laid off in masses and mortgage interest rates were going up so the opposite occurred. When people were able to go back to work mortgage interest rates declined so the opposite occurred again. My opinion? Had that gone in reverse with mortgage interest rates increasing slightly while people went back to work we probably would not be in this particular situation. Sadly, mortgage interest rates fell to all time lows for 18 months or so opening up far too much opportunity for our housing market to fall out of alignment in the first place.
Phoenix Housing Market Outlook

Powell never said he wanted our home values to decline!! What he is trying to do is cause the rate in which properties are increasing in value to slow down. If you look at the gains in the real estate market over just the last 2 years, not to mention the last 5 years, you understand why. See below.

That kind of rapid appreciation is not normal nor is it healthy. Had we continued down that road no one would be able to afford to buy a home at some point. While I’m never a fan of the federal government stepping in to “correct” things, this time it may have been completely necessary for the good of everyone. As much as I want to disagree with government getting involved, the jury is still out. I guess we will wait and see.
So where are we currently and what does this picture look like as far as the housing market? Take a look below to see the balanced state of our current market and how different it is from 2008.
Housing Market in 2022 vs. 2008

You can see how the “market crash of 2008” actually began in 2006 and continued through to roughly 2009. Demand for housing was at an all time low (roughly 4000 properties in escrow) while supply was at an all time high (roughly 56,000 available properties listed for sale). That plunged our property values by roughly 54%. We came out of a buyers market and into a sellers market only to go right back into a buyers market in 2011. The buyers market of 2011 was only a 6 month term and corrected quickly. If you look at our market conditions today you’ll see for yourself we are no where in the vicinity of that 2008 crash. Our last balanced market was in 2014 which does directly reflect the state of our market today.
If the demand line and the supply line cross each other like they did in 2005 and 2011 we may be headed for a small short term buyers market where we see appreciation less than the rate of inflation and possibly no appreciation in value year over year. It’s important to understand we are talking about year over year numbers! For now we are in a balanced market overall where properties appreciate at the rate of inflation per year. If we do head into a short term buyers market it will not likely cause property values to plummet unless it’s long term. If the buyers market is a long term condition, like in the market crash, then we will see depreciation in values. For now that is not the concern. In a later slide I’ll show which Greater Phoenix areas are in a buyers market.
Supply vs. Demand Now

The gauges above reflect supply has, for the first time in years, gone above the level of demand, but only slightly. In 2007, just before all of the financial pain hit, the Cromford Market Index was at 27, not 93.9. 100 is balanced so we are basically in a balanced market. We still have buyer demand also! Buyers are still buying and sellers are still selling their homes! The last 2 years were so odd that we forgot what balanced feels and looks like.
When Powell said he wanted to balance the housing market this is what he was after. Supply and demand needed to fall more in line so prices stopped surging and housing would become affordable. Powell already achieved his goal in the Phoenix market back in August, however, what Powell is not doing is paying attention to the fact that housing has a lagging indicator of correction. Stock markets show results quickly! Housing does not. At this point Powell is overcorrecting in our Phoenix housing market potentially driving it into a buyers market.
This is why I believe every time the government gets involved they end up doing harm where they meant to do good just like the First Time Home Buyer Credit of 2008 that didn’t work and led to the buyers market of 2011. It was meant to assist first time buyers but hurt the overall market instead by delaying the inevitable. Like I said above, we will have to wait and see.
Just for reference see below to compare the difference between now and April of 2022 with 5% interest rates for the first time since 2018.

After the insanity of the housing market in 2020 and 2021, with 2% and 3% interest rates being the driving force, the buyer pool went into shock when rates hit 5% on April 5, 2022. Buyers saw these interest rates as too high and wanted to “wait out the market” until they “came back down”. When they did “come back down” ironically to 5% in August 1, 2022 we saw a spike in listings under contract. The initial shock of 5% interest rates wore off and reality set in that 2% and 3% mortgage interest rates are not normal and that 5% isn’t all that bad after all. Interest rates don’t stay high and they don’t stay low which is why you always strike when the iron is hot.
What is a Balanced Housing Market?
Balanced markets appreciate at the rate of inflation per year and are usually beneficial for both buyer and seller. We have a balanced supply and demand number. Buyers have an opportunity to shop for the right home and sellers will spend a little more time looking for that buyer. Closing costs paid by the seller to the buyer are more prevalent just like sellers performing repairs on the home. Our last balanced market was in 2014. Take a look below

In the slide above you can see the numbers that reflect a balanced market like 2014. You can also see the seasonality each year as sales trail off a bit in the 4th quarter.
Seasonality of Housing
In the 4th quarter of any year buyers have an advantage over sellers. Right now sellers overall are not desperate to sell! They have affordable mortgage payments and can afford to just stay put and wait until the spring to list their homes. Sellers that are selling in the 4th quarter are absolutely more driven to sell. They would not list their home during this time of year unless there were important driving factors causing them to list at an inopportune time of year. Sellers typically make less on their homes during the 4th quarter not only in list price but in profit due to the concessions they pay out to the buyer, especially this year!
What does that mean for buyers? The 4th quarter is the best time of year to find a highly motivated seller that will assist with closing costs. Right now sellers are willing to assist buyers to buy down their interest rates making that home more affordable. That means sellers are offering funds in the way of closing costs to buy the rate down 1% for a permanent buy down, a 2/1 buy down or a 3/2/1 buy down so you aren’t paying 7.3% mortgage interest rates. Honestly, they might be higher once you find a great home. We simply won’t know how high they will go until that happens.
Powell simply indicated that he wanted to raise rates by 75bps and rates increased the next day. With seller assistance to buy down that interest rate buyers are better able to buy the home they really love and subvert the high rates. Take a look below.

Buyers that have been waiting for a “Buyers Market”
If that is you or someone that you know these conditions are why the housing market would head into a buyers market in the first place. Buyers markets come from less than optimal economic circumstances making them more painful than balanced or warm sellers markets. Many buyers waiting for buyers markets sometimes get pushed out of buying all together simply because of the finance of it all.
If buyers are buying with all cash, have extra cash to throw at the purchase during a hot sellers market or they can weather high interest rates during a buyers market it doesn’t matter what market they buy in. Markets go up and they go down! Just like interest rates. Property will always appreciate in value and interest rates always come back to a lower rate for refinance in a short amount of time. Savvy buyers know this.
Housing Temperature Around Greater Phoenix
As promised I’ll leave you with one more slide to reflect the different areas of town and the market in those areas.
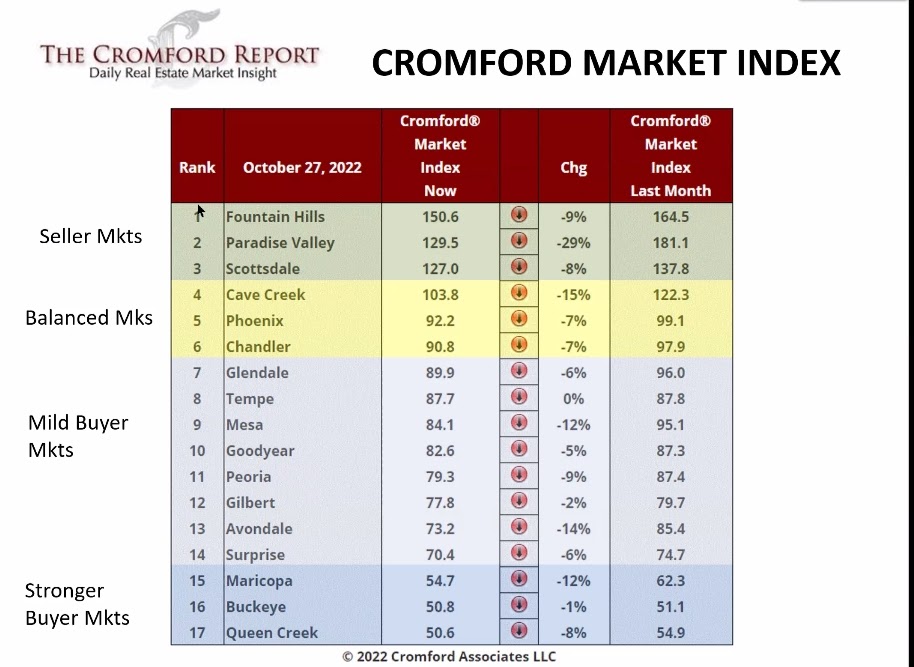
A Cromford Market Index less than 90 indicates a Buyers Market, an index above 110 indicates a sellers market. Between 90 and 110 is a balanced market. While I live in Cave Creek and love selling homes in Cave Creek, N Scottsdale and Carefree I have a ton of clients that I’ve worked with in almost every single area on this list. Most which will be reading this market update so here comes the good news for everyone!
I included the maps of the Greater Phoenix Economic Counsel for a very good reason! While the west and east valley may have lost a little bit of steam in their markets and are technically in a buyers market it is absolutely a short term situation. Taiwan Semiconductor has opened the door for areas like Surprise, Peoria, Glendale, Youngtown, Sun City (both the 55+ portion and the portion considered Sun City off of the 303 that is not 55+) to gain major traction in their property values. That also plays into Anthem, the Desert Hills and New River areas also. In the east valley many companies moving to the Phoenix area are going to be producing the items that Taiwan Semiconductor will need for their production.
Cave Creek, N Scottsdale and Carefree will also pick up even more steam. The luxury market in these areas is still doing very well. This area has less room for new construction than the outer areas of town so our population growth will be more limited due to that reason returning to a supply and demand situation once this financial blip is over.
Speaking of new construction, many of the cities on this list that are on the outskirts have quite a lot of new construction available Those builders are very much inclined to give major credits to buyers right now. Lots of new construction is part of the reason there is a buyers market in most of these areas but it’s also a fantastic opportunity to buy a new build. New build lenders are offering rate buy downs just like so many other lenders across the valley. Rate buy downs are not a new concept and they are a 30 year fixed rate mortgage, not an ARM!! It’s simply buying the rate down to a reflect a better monthly payment financed by the seller.
I hope I was able to bring everyone up to speed on what is really happening in Phoenix! I’m not sure about other markets but here in Phoenix we should fair quite well after the pain is over. I know the media puts out a ton of information that can seem scary and cause emotional turmoil. When it comes to real estate just give me a call and I’ll give you the rundown as it truly is.
https://kuhlmankrew.com/home-buying/